Newton.js Graph
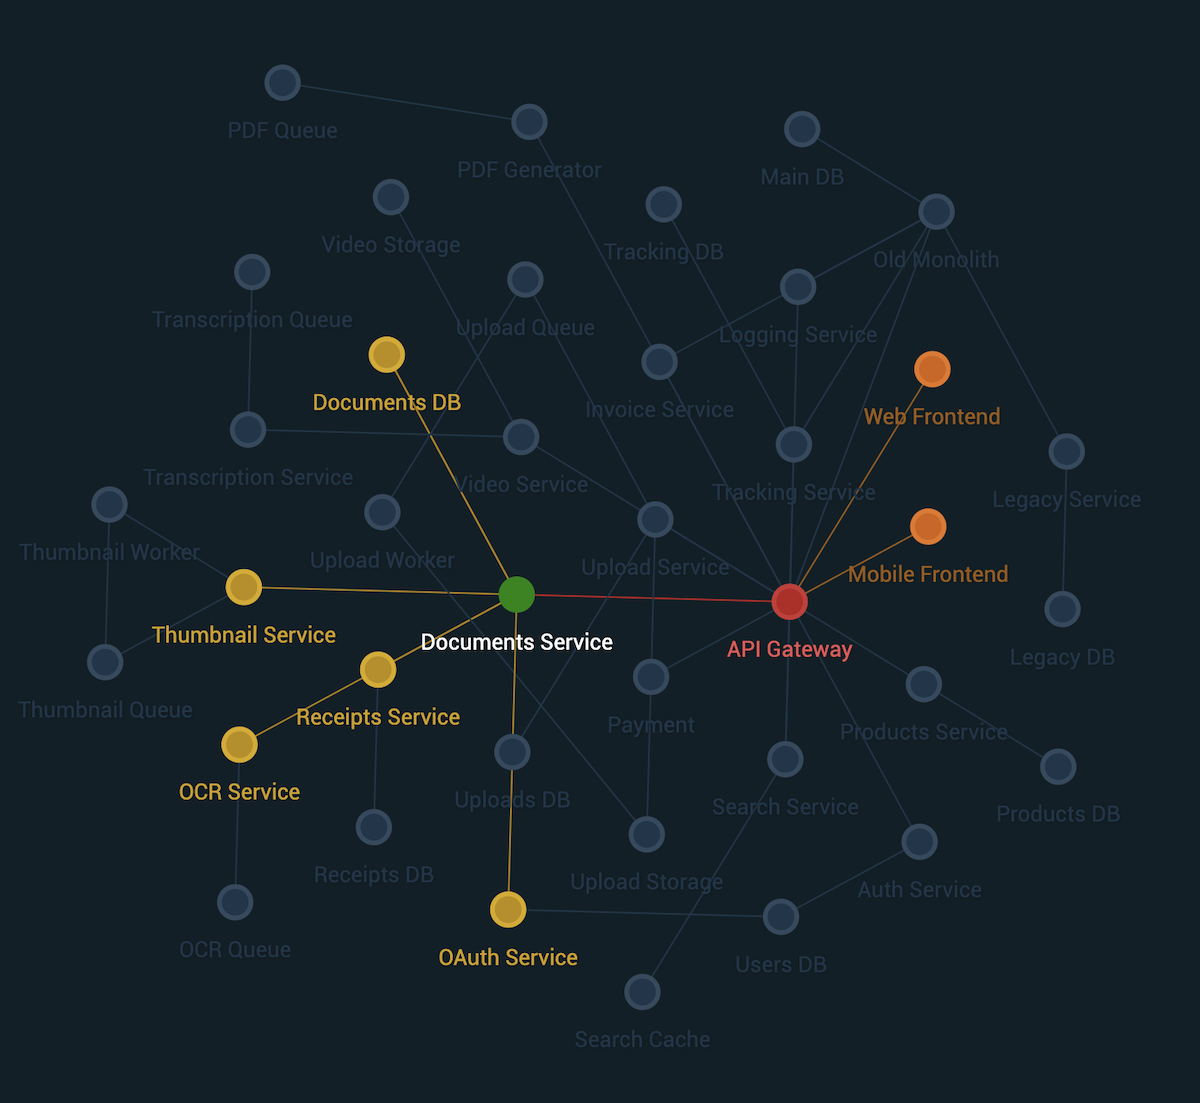
Newton.js Graph was a prototype library to create high-level real-time dashboards for architects and stakeholders to reveal insights about how Conway's Law applies to the organization. The goal was to visualize architectures in large organizations as organisms that live and breathe with deployments, problems, etc.
Preview
Example Code
Source Data
- Nodes: components in your application
- Links: describe relationships (sources and targets) between components
const data = {
    nodes: [
        { id: 'w', label: 'Web Frontend' },
        { id: 'm', label: 'Mobile Device' },
        { id: 'b', label: 'Monolith Backend' },
        { id: 'd', label: 'Database' },
    ],
    links: [
        { source: 'w', target: 'b' },
        { source: 'm', target: 'b' },
        { source: 'b', target: 'd' }
    ]
}
Graph Visualization
const network = new Network(data.nodes, data.links)
const graph = new Graph({
width: window.innerWidth,
height: window.innerHeight,
flow: 'horizontal',
draggable: true,
network: network // required
})
graph.init()
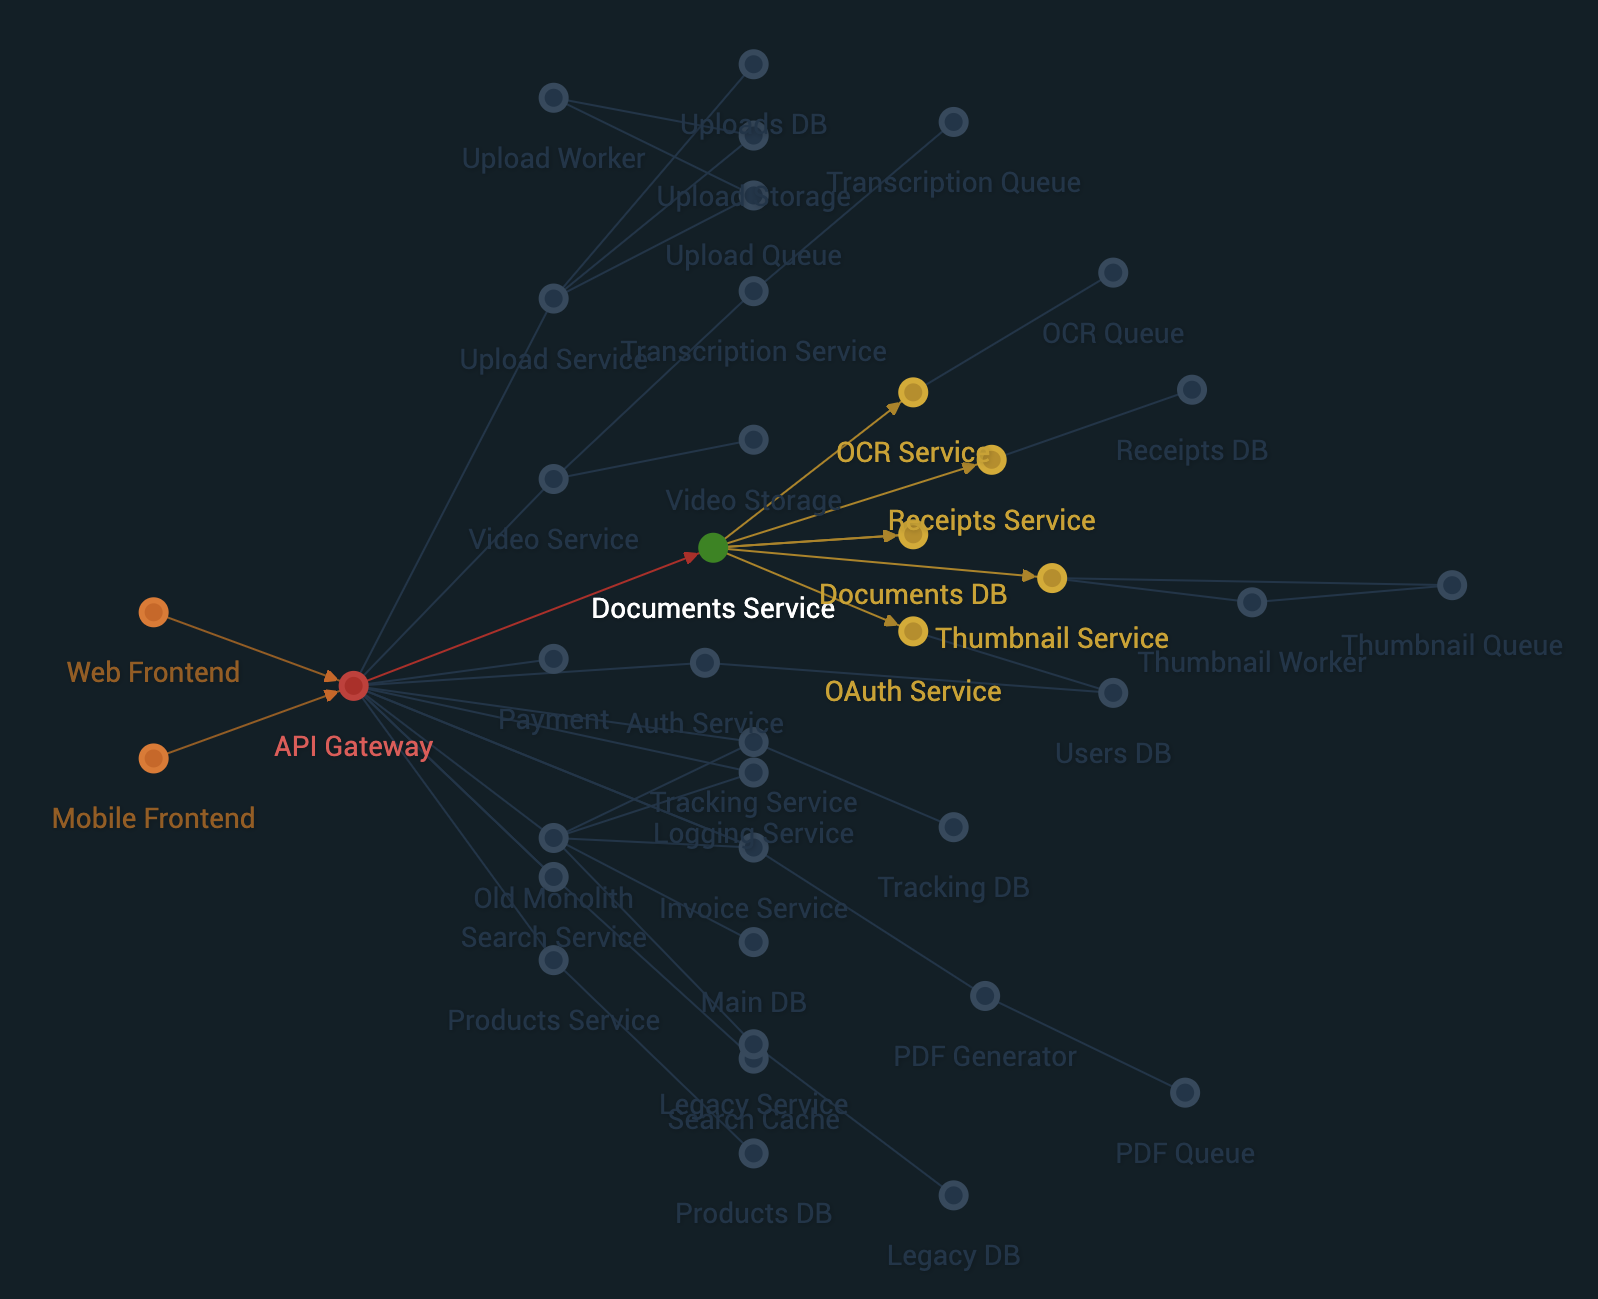
graph.on('node:click', (n) => {
graph.highlightDependencies(n, { arrows: true })
})
Styling
Customize the graph via CSS variables
:root {
    --graph-bg-color: --var(--navy-darker);
    --label-font-family: 'Roboto', sans-serif;
    --label-font-size: 14px;
    --label-text-shadow: 1px 1px 5px rgba(0,0,0,0.2);
    --link-stroke-width: 1px;
    --node-stroke-width: 3px;
}